The Leaders across Borders Certification Program—A Systemic Multiple Level Observation of Groups Analysis Approach to Measure Effective Leadership: A Case Study
The Leaders across Borders Certification Program—A Systemic Multiple Level Observation of Groups Analysis Approach to Measure Effective Leadership: A Case Study


- 1Keisen Consultores, Mexico City, Mexico
- 2US-MX Border Health Commission, Tijuana, Mexico
- 3Arizona Department of Health Services, Phoenix, AZ, United States
- 4Mel and Enid Zuckerman College of Public Health, University of Arizona, Phoenix, AZ, United States
Leadership measurement, feedback, and development have grown in importance for the field of management. The Mexico–US Border defined as the area of land within 100 km (62.5 miles) north and south of the international boundary, shares common challenges, and requires the development of multicultural change agents who conduct binational actions toward the improvement of public health and quality of life of the population in the region. Leaders across Borders (LaB) was established in 2010 as an advanced certified binational leadership development program aimed at building the capacity of public health, health care, and other community sector leaders working to improve the health of the communities in the Mexico–US Border region. Leadership as a social interaction process requires leader skills development to achieve goals promoting unity and reducing polarization to optimize interactions between all resources, thus improving teamwork. Therefore, measurement and feedback model of general values and beliefs that guide effective behavior, not only individual personality assessments need to drive a proactive learning and action plan development to improve interactions in a team, thus optimizing leadership. Starting 2014, we administered a new model named Systemic Multiple Level Observation of Groups (SYMLOG) to measure the values and beliefs that guide the behavior of learners and team facilitators. We also evaluated the effectiveness of each team of the program and established benchmarks and action plans to optimize interactions and communication between all the learners during the 8-month program. This leads to a stronger systemic network upon graduation from the program. The SYMLOG approach measured initial and improved situations of individual leadership and team performance effectiveness because of the LaB Program training and skills development sessions. The SYMLOG also provided positive feedback to each participant, which had a direct impact on the optimization of members’ interactions of all teams, as well as developing effective leadership values and behaviors of participants. This study presents a case study of this application, the challenges in the design and implementation of the SYMLOG measurement model, and the results obtained for last three cohorts 2014–2016 of LaB Program.
Introduction
Design Challenge
The measurement of effectiveness of a leadership program in terms of changes in participant behaviors is the central challenge of all leadership theories; therefore, different models of measurement and evaluation are available in the market (e.g., personality tests, talent evaluation, and abilities map). From a systems theory perspective, optimizing the complete system requires identifying a common purpose and optimizing interactions between the parties. Improving independent parts and subsequently adding these parts do not deliver effective results given that each part optimized does not improve the interrelations between them. Each part achieves its purpose, not necessarily meeting common goals and collaboration.
Leadership as a social process must measure and improve individual participants, but also the interactions between them and aligning to common goals (Bales and Cohen, 1979). We can achieve effectiveness through cohesion and unity (Bales, 1999).
Leaders and leadership development programs require the promotion of this systemic approach so they learn and optimize teams, as well as create effective networks toward common purposes (e.g., public health, quality, logistics, and change management). Measurement and feedback models that consider current behavior and the means to change it, and measure the values and beliefs that guide these behaviors are more likely to impact on leadership skills to optimize teams.
The Leaders across Borders (LaB) Certificate Program required a new model to measure learner’s current individual situation, current interactions in teams, and team effectiveness. Starting 2014, we administered a new model named Systemic Multiple Level Observation of Groups (SYMLOG) to measure the values and beliefs that guide the behavior of learners and team facilitators. We evaluated the effectiveness of each team of the program and established benchmarks and action plans to optimize interactions and communication between all the learners during the 8-month program, and measured improved situation of each learner and team effectiveness.
Leaders across Borders
Leaders across Borders was established in 2010 as an initiative sponsored and funded by the US–Mexico Border Health Commission (BHC). It is an academic certificate program, designed and applied in a binational context. The leadership development program aims to build the capacity of public health, health care, and other community sector leaders working to improve the health of the communities in the Mexico–US Border region. After successful completion of the program and curriculum, the Instituto Tecnológico de Monterrey, in Monterrey Mexico awards a certificate or diploma. Participants also receive a certificate of completion awarded by the Global Health Institute of the Mel and Enid Zuckerman College of Public Health of the University of Arizona.
Learners grouped into four binational teams to address four specific border health concerns, work together in a project during the 8-month program period meeting virtually (e.g., telephone and video conference) and during three face-to-face sessions. Each team is assigned a facilitator. The facilitator is not a member of the team and mainly serves to stimulate discussion, generate more questions than provide answers, promotes teamwork and keeps the team on task.
Measuring Effective Leadership Using SYMLOG Instrument
We used SYMLOG to quantify and contribute to the effective leadership processes and leadership skills development. The key requirements involved (1) measuring learner’s current situation, (2) measuring current situation of the four binational teams, (3) measuring improved situation of the learner, and (4) measuring improved situation of the teams.
Systemic Multiple Level Observation of Groups is a valid, reliable assessment, and feedback instrument used to measure the values and beliefs that guide the behavior of learners (i.e., individual leadership for effective teamwork). It also measured team performance, unity, and polarization between the team members (i.e., interactions in the team) and team’s facilitators (i.e., facilitator effectiveness) for three LaB cohorts during 2014–2016. For each cohort, learners rated concepts, team members, and teams and received an introduction to the SYMLOG model and their own individual report. Each learner and team received feedback during the second and third in-person LaB Program sessions. Each team and individuals developed and delivered action plans to simulate the improvements in the hypothetical effectiveness index that compared the Most Effective Profile (MEP) reference of each participant’s or team’s current and planned profiles thus, estimating magnitude of the implemented actions (Koenigs, 1999).
The key objectives of the measurement and feedback model during the 8-month program period consisted of the following: (1) measure, understand, and improve current personal and team leadership effectiveness based on their individual values that guide their behavior (i.e., set a benchmark); (2) map and optimize the interactions and communication between learners of each team to improve the overall team effectiveness by reducing polarization and promoting unity (i.e., significant distances between individuals in a force field diagram); (3) align individual and team’s profile to SYMLOG Model’s statistically validated and reliable reference for the MEP; and (4) develop a systemic network of leaders across the US–Mexico border region upon completing the program, contributing to their professional and organizational development.
Method
SYMLOG Measurement and Feedback Model
Systemic Multiple Level Observation of Groups is a comprehensive integration of findings and theories from psychology, social psychology, and sociology. This model involves a theory of personality, social interaction, and group dynamics system integrated with a set of practical methods to change behaviors and values in a democratic way. SYMLOG presents specific alternatives in which leaders and members can most effectively act to encourage desirable changes in individual and group performance, as well as in organizational culture alignment. It is a new field theory (Bales, 1985, 1999; Hare et al., 2005).
As field theory, SYMLOG takes effective account of the fact that every act of behavior takes place in a larger context; it is a part of an interactive field of influences. The measurement procedures of SYMLOG are designed to measure the behavior patterns, the values, and their larger context (i.e., individual, interpersonal, group, and external situation) to understand the patterns of behavior and to influence them successfully.
Leadership is defined as a process that unifies diverse groups of people to work effectively as a team toward a common purpose under varied and often difficult circumstances through the elimination of scapegoating, the maximization of mediation, and the judicious use of power.
To be effective, in simple terms, is achieving common goals maintaining and reinforcing the organizational unity.
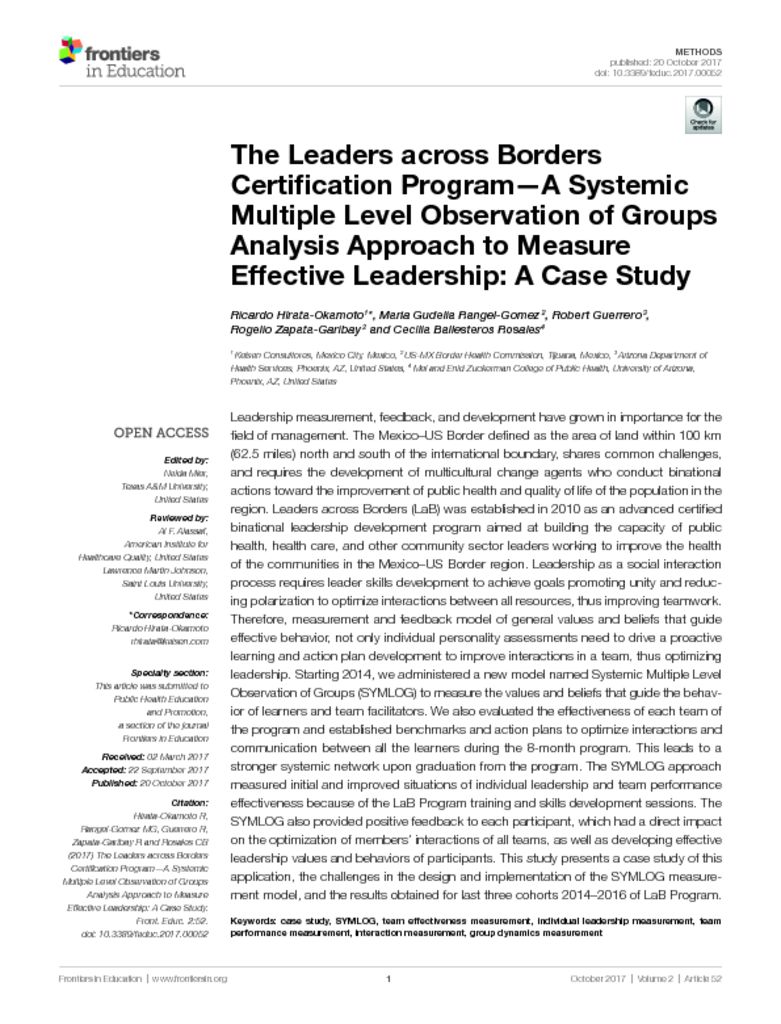
A SYMLOG has 26 descriptive items or values represented into three-bipolar behavioral characteristics in a Cartesian plane. These planes account for approximately 85% of the variance (i.e., factorial validity). It also includes vertical “Y axis” (F-B), acceptance vs non-acceptance of authority (i.e., acceptance vs non-acceptance of the task orientation of established authority), horizontal “X axis” (P-F), friendliness vs unfriendliness (i.e., individualistic vs group oriented behavior), and “Z axis” (size of the bubble U-D), dominance vs submissiveness (i.e., introvert vs extrovert behavior) (see Table 1; Appendix A-a in Supplementary Material).
Scale consistency and factor structure validity and reliability of the SYMLOG is the product of Bales’ rigorous qualitative participant observation and analysis of groups spanning more than 50 years from 1950 to 1999 (Bales, 1950, 1999; Bales and Cohen, 1979; Hare and Koenigs, 1999; Hare et al., 1999).
The field diagram is the Cartesian plane representation of a total theoretical space in which all possible types of behavior and values in groups can be represented (i.e., group space). The field diagram is a theoretical space of all possible behaviors, and an actual group generates a moving field of forces. Forces exist in the psychological pressures exerted by the behavior of each member on each of the others. As individuals react to each other, similarities and conflicts shape a group average field diagram visually representing overall tendencies and interactions in a defined span of time (Bales, 2004) (see Appendix A-b in Supplementary Material).
The SYMLOG bar graph provides an item-by-item profile of ratings (e.g., participant’s self-ratings and average of ratings of others on the team or another participant). Provides information on values and beliefs all raters perceive on concepts and other people, and delivers item-by item feedback useful for the development of an action plan (Appendix A-c in Supplementary Material).
The field diagram and the bar graph are graphical displays of SYMLOG rating data. As an example, Figure 1 shows the field diagram displaying images of circles for the six individuals of a team rated and their relative locations on the three-bipolar dimensions. For instance, one member’s position and respective statistical confidence interval, represented in blue, compared with the MEP (reference) and its statistical confidence interval, computes a Hypothetical Estimate of the Effectiveness of the current individual of 70.3% (i.e., effectiveness index). The frequency bar graph exhibits the average ratings made by all team members on the current individual (e.g., values this person shows in his/her behavior). The MEP is represented by the “E” line and is the valid and reliable reference to compare if our performance is “in range,” “over,” or “under” the MEP. Light pink colored values contribute to effective teamwork (shall not be underemphasized to be effective), medium pink colored values may be necessary but dangerous if overemphasized (shall not be under or overemphasized to be effective) and red colored values almost always interfere with teamwork (shall not be overemphasized to be effective).
 Figure 1. One team’s field diagram, bar graph, and estimated effectiveness index of an individual team member (Leaders across Borders 2015).
For each team, we generated outputs (i.e., graphs and feedback reports). Each team member received more than 15 feedback reports as evidence for needed changes. Subsequently, individuals and teams develop action plans to simulate their respective Hypothetical Estimate of the Effectiveness (i.e., effectiveness index).
Results
Program Design
We applied the LaB-SYMLOG measurement and feedback process to individuals (i.e., learners and facilitators) of three cohorts: 2014–2016 (see Table 2). The focus was on learner’s perceptions, an examination of the norms of the team, and each individual’s contribution to the overall effectiveness of their team. We considered the following factors in developing the design: (1) LaB group of 24–25 individuals (learners and facilitators); (2) divided into four binational teams; (3) English and Spanish simultaneous programs, ratings, analysis, and reports per person and per team; (4) aggregated data reports (i.e., results from combined teams 1–4); and (5) generation of executive bilingual reports for organizers and key stakeholders of the program. In total, we executed eight hybrid programs, simultaneously every year, considering individual ratings and team ratings per group per language. Thus, each learner and facilitator received more than 15 different feedback reports generated and delivered in a personal binder. In addition, all learners and facilitators received during the in-person sessions, results, feedback, guidelines, and tips.
 Table 2. Number of teams and participants in the Leaders across Borders (LaB) Program 2014–2016 (three cohorts of participants and teams).
Rating Process, Analysis, and Feedback
The measurement and feedback process was designed and deployed for each cohort as follows:
(1) Considered all learners and facilitators grouped into four binational teams;
(2) Sent welcome letter, instructions, and personal access links to all participants for online ratings by the end of the first in-person session (March–April);
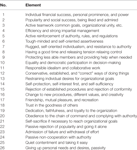
(3) All learners rated 26 descriptive items on each one of multiple concepts and questions (May–June) (see Table 1). These concepts and questions are associated with key images that influence effective individual leadership, teamwork, and organizational proactivity such as self-image, desired personal image, values I reject, image of other participants, image of the current team, and image of desired ideal (see Table 3);
(4) Data analysis and generation of personal reports on self-ratings and ratings made by others were processed (June–July);
(5) Presented reports with the results, feedback, and recommendations, and teams coached during the second and third in-person sessions (July and October);
(6) Defined and submitted by all learners, facilitators, and teams action plans for individual and team’s effectiveness improvement (August–September);
(7) Simulated potential improvement in individual and team effectiveness, and additional reports deployed (September); and
(8) Presented, during the third in-person session, a new Hypothetical Estimation of Alignment of individual and team’s effectiveness (i.e., personal and team’s effectiveness index) (see Figure 2).
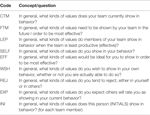 Table 3. Systemic Multiple Level Observation of Groups – Leaders across Borders concepts and questions.
 Figure 2. Systemic Multiple Level Observation of Groups (SYMLOG) in Leaders across Borders (LaB) process (LaB 2014–2016).
Results
The SYMLOG model approach contributed to the measurement of both, current and improved state of individual leadership and team performance effectiveness through LaB Program training and skills development sessions. Feedback reports and group coaching generated positive feedback to each participant who then learned to improve and optimize his/her interactions in the team, and developed effective leadership values and behaviors.
Team members learned and understood their personal values that guide their behaviors and the existing differences between them (i.e., team members) in the three-bipolar behavioral characteristics field diagrams. As shown in Figure 3, distances in the field diagrams taught the existence of polarization between team members and the need for cohesion to improve the team’s performance, as well as the need to align to the MEP reference to be more effective (i.e., achieve the goals maintaining unity).
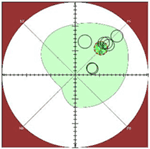 Figure 3. Team’s field diagram showing seven members with significant distances between some of them (polarization in values and behavior) (Leaders across Borders 2015).
We measured teamwork effectiveness as well as its improvement, adding the Hypothetical Estimation of Alignment of the current situation vs the Optimum Profile (i.e., effectiveness index) as a potential key performance indicator. For example, in Figure 4, the impact of one team’s action plan was simulated, and the team effectiveness index shows a potential change from 61.5 to 95.6% during the LaB Program. The current behavior (zone circled in blue) appears to the right of the MEP, which means members and the team, both value friendship, equality, democratic participation in decision-making, protecting less able members and recreation. This same graph also measured individual effectiveness for all learners comparing their current situation, personal action plan simulation vs Optimum Profile’s effectiveness index.
 Figure 4. Field diagram, bar graph, and changes in the estimated effectiveness index of one team (current and planned situation) (Leaders across Borders 2015).
After 3 years of measuring the LaB Program participants (learners and facilitators) and respective teams, we were able to calculate and estimate the improvement in the effectiveness index when comparing the initial measurement made in the first months of the program with the results of the impact of their action plans presented at the last in-person session. The 3-years’ individual effectiveness index average improved from 70.5 to 88.35%, and the average of the effectiveness index of the binational teams improved from 73.60 to 90.01% by the end of each program (see Table 4).
 Table 4. Combined binational teams effectiveness index data 2014–2016 (three cohorts of participants and teams).
Systemic Multiple Level Observation of Groups analysis also provided scatter field diagrams showing dispersion in the individual ratings on individuals or concepts (e.g., individual images of their current team, future team, and team members). Figures 5–7 show personal images of “Effective Person” as rated by the program participants of each LaB Program (2014–2016). The scatter graph shows all plots (i.e., certificate program participants) with central tendency matching the MEP location (dark green circle) and its spread matching the statistical confidence interval (light green area), thus validating SYMLOG application. Each person has its own image of effective behavior; however, these graphs demonstrate the validity of the SYMLOG’s MEP Reference. No matter where you live or work, SYMLOG studies have proven to determine valid and reliable values and beliefs of an effective person, team, or organizational culture (Koenigs, 1999).
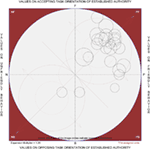 Figure 5. Scatter plot of ratings on values that guide the behavior of the most effective person (all 25 individual ratings, 4 teams combined, Leaders across Borders 2014).
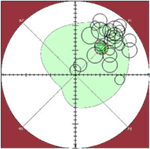 Figure 6. Scatter plot of ratings on values that guide the behavior of the most effective person (all 24 individual ratings, 4 teams combined, Leaders across Borders 2015).
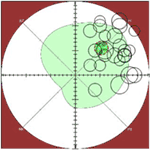 Figure 7. Scatter plot of ratings on values that guide the behavior of the most effective person (all 24 individual ratings, 4 teams combined, Leaders across Borders 2016).
Limitations of the Case Study
Annual study is limited to the selected participants, four teams, the 8-month period of the Certificate Program and its three in-person sessions. Sociodemographic stratification (e.g., age, gender, ethnicity, educational background, and experience) are neither variables for the selection of the participants nor the purpose of this LaB Program.
Conclusion
Leadership as a social process that unifies diverse groups of people to work effectively as a team can be measured through understanding individual and group values that guide their behavior. The use of the SYMLOG model was successfully applied to measure and feedback the LaB Binational Leadership Program learners and respective teams, delivering relevant feedback reports and the opportunity to share the importance of systemic thinking for the optimization of the interaction of the parts (e.g., people, teams, and resources) toward common goals. All learners shared the need to improve their interactions and not only focus on individual growth, they received information regarding the elements that guide their behaviors and implemented important steps toward a more effective profile not by changing the behavior itself, but by learning new values and beliefs.
After applying the instrument three consecutive years, we face new challenges and generate additional questions: (1) How can the role and performance of the facilitators contribute toward the effectiveness of a Binational team during the program? (2) Are there significant differences when comparing the effectiveness index measured during the LaB Program and a new SYMLOG measurement upon completing the program, when returning to their daily routine, and actively interacting with their coworkers? (3) Are there significant differences in the current work performance and effective leadership of the learners from first cohort (before 2014), and those who participated in these last three using the SYMLOG measurement and feedback model?
Our next steps will involve continuity of the SYMLOG Model with future LaB participants, and measuring the individual leadership effectiveness of a sample of individuals from all LaB cohorts (before 2014 and after) and having their coworkers, peers, and superiors rate them.
Ethics Statement
Committee for Research Involving Human Subjects: student participation in the evaluation was voluntary and strictly anonymous. The project was submitted for approval by the ethics committee established by the Mexico Section of the US–Mexico Border Health Commission. All information provided by the participants was verbally authorized. Consent and authorization from participants: all participants in the LaB Program, including the facilitators, are required to agree upon the Program Commitments. All participants agreed to “Fully participate in Leaders across Borders learning activities” and “Provide feedback and evaluation information” (see Appendix B: Leaders across Borders Application and Section F: Program Commitments in Supplementary Material).
Author Contributions
RH-O: conception of the work, LaB SYMLOG measurement program design, implementation, analysis, and feedback, work draft, and approval. MR-G, RG, and CR: LaB Program coordinator, co-conception and approval for the LaB SYMLOG measurement program, work reviewer, and approval. RZ-G: contribution to the design of the work, LaB Program facilitator, reviewer of the work, and approval.
Conflict of Interest Statement
The authors do not have any conflict of interests to declare. This article was prepared in the absence of any commercial relationships construed as a potential conflict of interest.
Acknowledgments
This work would not have been possible without the support of the United States-Mexico Border Health Commission and Robert J Koenigs & Margaret Cowen from SYMLOG Consulting Group.
Supplementary Material
The Supplementary Material for this article can be found online at https://www.frontiersin.org/article/10.3389/feduc.2017.00052/full#supplementary-material.
References
Bales, R. F. (1950). Interaction Process Analysis. Cambridge, MA: Addison-Wesley. Reprinted 1976, University of Chicago Press.
Bales, R. F. (1999). Social Interaction Systems: Theory and Measurement. New Brunswick, NJ: Transaction Publishers.
Bales, R. F. (2004). Overview of the SYMLOG System: Measuring and Changing Behavior in Groups. San Diego, CA: SYMLOG Consulting Group.
Bales, R. F., and Cohen, S. P. (1979). SYMLOG: A System for the Multiple Level Observation of Groups. New York, USA: The Free Press.
Hare, P., Sjovold, E., Baker, H., and Powers, J. (2005). Analysis of Social Interaction Systems, SYMLOG Research & Applications. USA: University Press of America.
Hare, S. E., Hare, P. A., and Koenigs, R. J. (1999). SYMLOG and Issues of Validity. Working paper. San Diego, CA: SYMLOG Consulting Group.
Hare, S. E., and Koenigs, R. (1999). SYMLOG and Issues of Reliability. Working paper. San Diego, CA: SYMLOG Consulting Group.
Keywords: case study, SYMLOG, team effectiveness measurement, individual leadership measurement, team performance measurement, interaction measurement, group dynamics measurement
Citation: Hirata-Okamoto R, Rangel-Gomez MG, Guerrero R, Zapata-Garibay R and Rosales CB (2017) The Leaders across Borders Certification Program—A Systemic Multiple Level Observation of Groups Analysis Approach to Measure Effective Leadership: A Case Study. Front. Educ. 2:52. doi: 10.3389/feduc.2017.00052
Received: 02 March 2017; Accepted: 22 September 2017;
Published: 20 October 2017
Edited by:
Nelda Mier, Texas A&M University, United States
Reviewed by:
Al F. Alassaf, American Institute for Healthcare Quality, United States
Lawrence Martin Johnson, Saint Louis University, United States
Copyright: © 2017 Hirata-Okamoto, Rangel-Gomez, Guerrero, Zapata-Garibay and Rosales. This is an open-access article distributed under the terms of the Creative Commons Attribution License (CC BY). The use, distribution or reproduction in other forums is permitted, provided the original author(s) or licensor are credited and that the original publication in this journal is cited, in accordance with accepted academic practice. No use, distribution or reproduction is permitted which does not comply with these terms.
*Correspondence: Ricardo Hirata-Okamoto, [email protected]


